The skillset every growing business in Punjab is hiring for right now
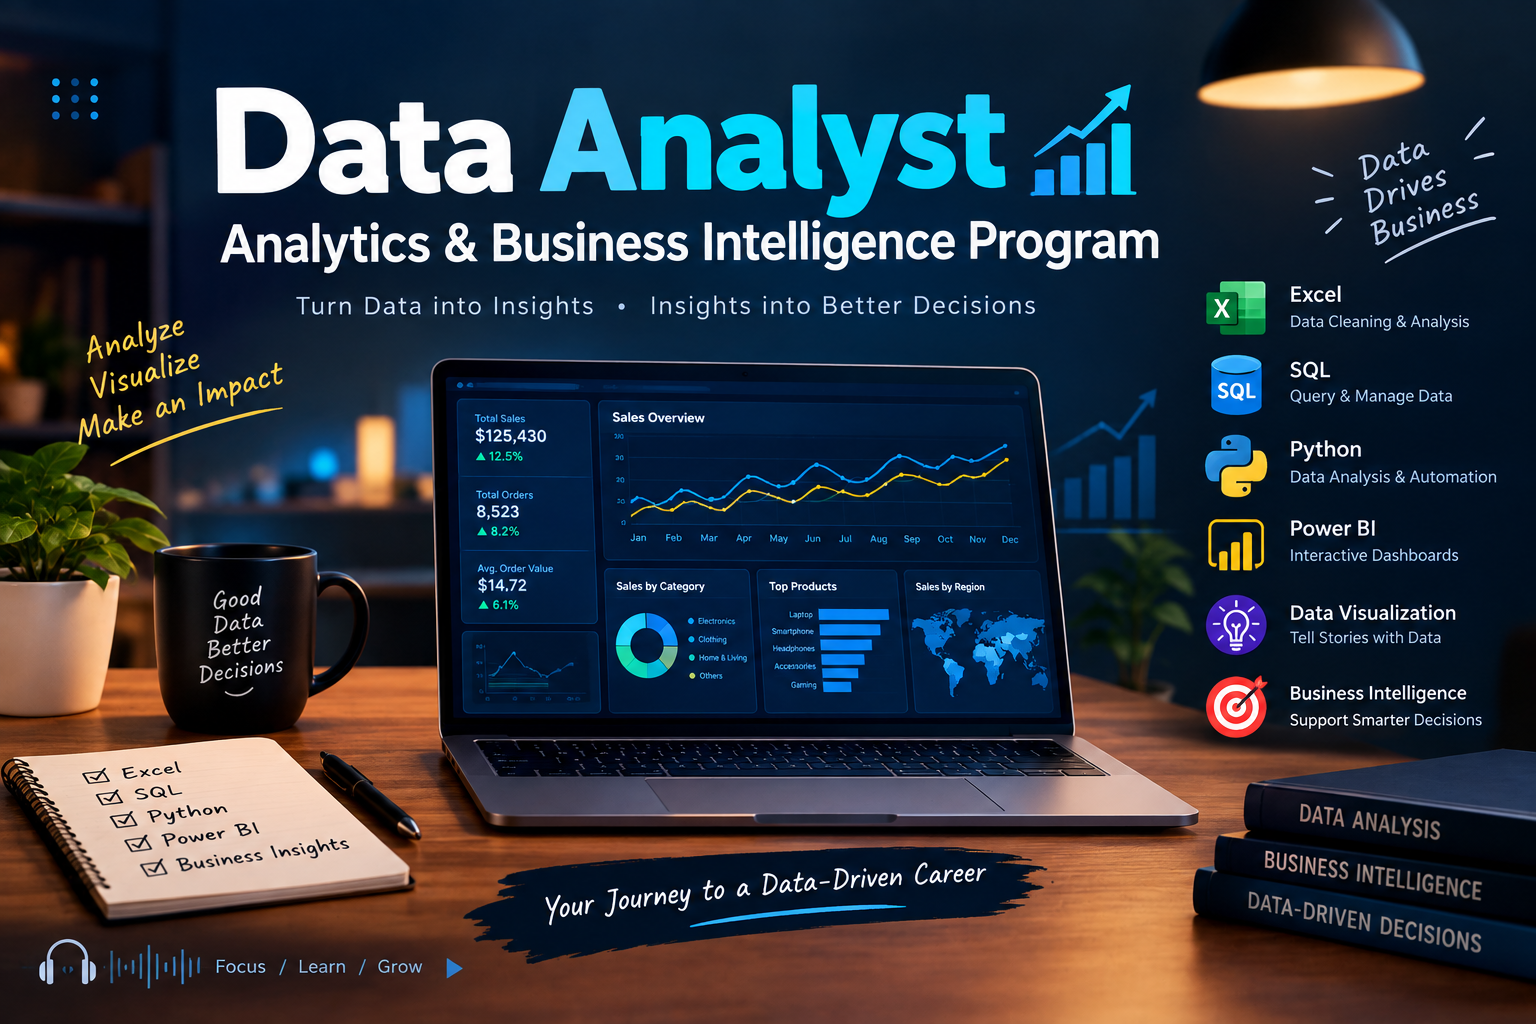
Learn Excel, SQL, Python, and Power BI by working on real datasets and building dashboards you can show employers. Small batches of 10–12 students, weekly mentor reviews, documented deliverables, and placement support.
Learn Data Analyst — Analytics & Business Intelligence through practical experience
techcadd's Data Analyst Course in Ludhiana is a practical, tool-first program that takes you from spreadsheet basics to SQL querying, Python analysis, and live Power BI dashboards.
The learning arc moves from Excel fundamentals and Python programming into NumPy, Pandas, and exploratory data analysis, then into SQL, statistics, and Power BI — with machine learning and deployment added in the longer tracks.
You finish with a cleaned dataset, a SQL query set, a live Power BI dashboard, an EDA report, and a documented ML project — plus CV preparation, interview coaching, and placement support.
Placement assistance, Live projects, Internship certificate
Curriculum
A path from first steps to shipped work
The Data Analyst program is a nested ladder — each longer track includes every module from the shorter tracks and adds more depth. No module is repeated; you continue building on the same dataset and portfolio from the previous stage. Below is the complete module breakdown for each of the three tracks.
6 learning modules01 / 06
Module 01 · 4 weeks
Excel & Python Essentials
Working knowledge of Excel and core Python syntax for handling and structuring data.
Topics covered
Excel Fundamentals
Tables & Formatting
Conditional Formatting & Formulas
Lookup Functions
Pivot Tables & Charts
Python Introduction
Operators
Conditional Statements & Loops
You finish with
3-Month
Module 02 · 4 weeks
Python OOP & Data Libraries
Object-oriented Python and the core data libraries used for cleaning, transforming, and visualizing datasets.
Topics covered
Comprehensions
Functions
OOP — Classes & Objects
Inheritance
Polymorphism
Encapsulation
File Handling
Exception Handling
You finish with
3-Month
Module 03 · 4 weeks
EDA, SQL & Business Intelligence
Querying, cleaning, and dashboarding skills that turn raw business data into decision-ready insight.
Topics covered
Data Cleaning & Transformation
Data Visualization
SQL — DDL
DML
DCL
SELECT
WHERE
ORDER BY
Joins & Subqueries
DAX Fundamentals
You finish with
3-Month
Module 04 · 4 weeks
Advanced SQL & Data Modeling
Writing production-grade SQL and designing relational schemas that support reliable reporting.
Topics covered
Complex Joins
Nested Subqueries
Common Table Expressions
Window Functions
Stored Procedures
Indexing Basics
Query Optimization
Relational Data Modeling
You finish with
6-Month
Module 05 · 4 weeks
Capstone Analytics Project & Career Preparation
Building interactive, published dashboards that leadership can filter and act on.
Topics covered
Power Query
Data Transformation
Star Schema Modeling
Relationships
Calculated Columns
Measures
DAX Time Intelligence
Row-Level Security
You finish with
6-Month
Module 06 · 5 weeks
Capstone Analytics Project & Career Preparation
Delivering a complete analytics project from raw data to a presented business recommendation.
Topics covered
End-to-End Analytics Project
Business Question Framing
Data Cleaning Pipeline
SQL Analysis Layer
Power BI Reporting Layer
You finish with
6-Month
Every module includes hands-on practice on a real dataset or a real deliverable, not a slide demonstration.
What you learn
What you will learn in the Data Analyst course
The Data Analyst Course in Ludhiana at techcadd is designed to take students from spreadsheet basics to SQL querying, Python analysis, and live dashboards.
01
Excel & Spreadsheets
Build lookup formulas, pivot tables, and charts for everyday business reporting.
02
Python Programming
Write clean Python with functions, OOP, file handling, and data structures.
03
Data Cleaning & EDA
Clean, transform, and explore real datasets using NumPy, Pandas, Matplotlib, and Seaborn.
04
SQL Querying
Write joins, subqueries, aggregations, and window functions against relational databases.
05
Power BI & DAX
Model data, write DAX measures, and publish interactive KPI dashboards.
06
Statistics for Analysis
Apply mean, median, and probability to make defensible analytical claims.
07
Machine Learning Basics
Train, tune, and evaluate predictive models with Scikit-learn.
Tools you’ll work with
Excel
Python
NumPy
Pandas
Matplotlib
Seaborn
SQL
Power BI
Streamlit
The objective is practical knowledge rather than memorised concepts — you finish with a portfolio of documented deliverables you can show employers.
Find your pace
What you can do, phase by phase
The Data Analyst — Analytics & Business Intelligence syllabus in the order you meet it, and what you are able to do by the end of each stretch of it. Every row is a capability, not a topic you sat through.
Every capability in the Data Analyst — Analytics & Business Intelligence syllabus, and the phase it is covered in
OOP — Classes & ObjectsPython OOP & Data Libraries
Covered in Foundations
Covered in Applied
Covered in Professional
InheritancePython OOP & Data Libraries
Covered in Foundations
Covered in Applied
Covered in Professional
PolymorphismPython OOP & Data Libraries
Covered in Foundations
Covered in Applied
Covered in Professional
EncapsulationPython OOP & Data Libraries
Covered in Foundations
Covered in Applied
Covered in Professional
File HandlingPython OOP & Data Libraries
Covered in Foundations
Covered in Applied
Covered in Professional
Exception HandlingPython OOP & Data Libraries
Covered in Foundations
Covered in Applied
Covered in Professional
Data Cleaning & TransformationEDA, SQL & Business Intelligence
–Not yet covered in Foundations
Covered in Applied
Covered in Professional
Data VisualizationEDA, SQL & Business Intelligence
–Not yet covered in Foundations
Covered in Applied
Covered in Professional
SQL — DDLEDA, SQL & Business Intelligence
–Not yet covered in Foundations
Covered in Applied
Covered in Professional
DMLEDA, SQL & Business Intelligence
–Not yet covered in Foundations
Covered in Applied
Covered in Professional
DCLEDA, SQL & Business Intelligence
–Not yet covered in Foundations
Covered in Applied
Covered in Professional
SELECTEDA, SQL & Business Intelligence
–Not yet covered in Foundations
Covered in Applied
Covered in Professional
WHEREEDA, SQL & Business Intelligence
–Not yet covered in Foundations
Covered in Applied
Covered in Professional
ORDER BYEDA, SQL & Business Intelligence
–Not yet covered in Foundations
Covered in Applied
Covered in Professional
Joins & SubqueriesEDA, SQL & Business Intelligence
–Not yet covered in Foundations
Covered in Applied
Covered in Professional
DAX FundamentalsEDA, SQL & Business Intelligence
–Not yet covered in Foundations
Covered in Applied
Covered in Professional
Complex JoinsAdvanced SQL & Data Modeling
–Not yet covered in Foundations
Covered in Applied
Covered in Professional
Nested SubqueriesAdvanced SQL & Data Modeling
–Not yet covered in Foundations
Covered in Applied
Covered in Professional
Common Table ExpressionsAdvanced SQL & Data Modeling
–Not yet covered in Foundations
Covered in Applied
Covered in Professional
Window FunctionsAdvanced SQL & Data Modeling
–Not yet covered in Foundations
Covered in Applied
Covered in Professional
Stored ProceduresAdvanced SQL & Data Modeling
–Not yet covered in Foundations
Covered in Applied
Covered in Professional
Indexing BasicsAdvanced SQL & Data Modeling
–Not yet covered in Foundations
Covered in Applied
Covered in Professional
Query OptimizationAdvanced SQL & Data Modeling
–Not yet covered in Foundations
Covered in Applied
Covered in Professional
Relational Data ModelingAdvanced SQL & Data Modeling
–Not yet covered in Foundations
Covered in Applied
Covered in Professional
Power QueryCapstone Analytics Project & Career Preparation
–Not yet covered in Foundations
–Not yet covered in Applied
Covered in Professional
Data TransformationCapstone Analytics Project & Career Preparation
–Not yet covered in Foundations
–Not yet covered in Applied
Covered in Professional
Star Schema ModelingCapstone Analytics Project & Career Preparation
–Not yet covered in Foundations
–Not yet covered in Applied
Covered in Professional
RelationshipsCapstone Analytics Project & Career Preparation
–Not yet covered in Foundations
–Not yet covered in Applied
Covered in Professional
Calculated ColumnsCapstone Analytics Project & Career Preparation
–Not yet covered in Foundations
–Not yet covered in Applied
Covered in Professional
MeasuresCapstone Analytics Project & Career Preparation
–Not yet covered in Foundations
–Not yet covered in Applied
Covered in Professional
DAX Time IntelligenceCapstone Analytics Project & Career Preparation
–Not yet covered in Foundations
–Not yet covered in Applied
Covered in Professional
Row-Level SecurityCapstone Analytics Project & Career Preparation
–Not yet covered in Foundations
–Not yet covered in Applied
Covered in Professional
End-to-End Analytics ProjectCapstone Analytics Project & Career Preparation
–Not yet covered in Foundations
–Not yet covered in Applied
Covered in Professional
Business Question FramingCapstone Analytics Project & Career Preparation
–Not yet covered in Foundations
–Not yet covered in Applied
Covered in Professional
Data Cleaning PipelineCapstone Analytics Project & Career Preparation
–Not yet covered in Foundations
–Not yet covered in Applied
Covered in Professional
SQL Analysis LayerCapstone Analytics Project & Career Preparation
–Not yet covered in Foundations
–Not yet covered in Applied
Covered in Professional
Power BI Reporting LayerCapstone Analytics Project & Career Preparation
–Not yet covered in Foundations
–Not yet covered in Applied
Covered in Professional
The full programme runs 3 / 6 / 9 Months. Where you finish is a question of pace rather than of syllabus — everyone covers all of it.
The case for it
Your months should build more than a certificate.
A course is worth the time you give it only if you finish with work you can show and skills you can defend.
5Documented analytics deliverablesfrom cleaned data to live dashboards
Handle missing values, duplicates, and inconsistent formats in Python and Excel.
Write joins, subqueries, and aggregations against a real relational database
Model data and publish KPI dashboards in Power BI.
Turn analysis into a business recommendation a manager can act on.
Why this course
Why should you choose this course?
Six things we hold ourselves to for every Data Analyst — Analytics & Business Intelligence batch that starts in Ludhiana.
01
Live project portfolio
You'll leave with 2–3 real projects to show in an interview, not just a certificate.
02
Real datasets, real tools
You work on live datasets in Excel, SQL, Python, and Power BI — not sample files made for teaching.
03
SQL you can defend
Joins, subqueries, and window functions written against a real relational database, not textbook examples.
04
Published Power BI dashboards
You publish live dashboards with DAX measures, KPI cards, and drill-through — the reporting layer employers actually ask for.
05
Documented internship
Every student receives a documented internship certificate alongside their course certificate.
06
Placement support
Resume and LinkedIn preparation, interview coaching, and active placement assistance for analyst roles.
Why TechCadd
Why students choose us for this
What genuinely differs about this program at techcadd is that every tool is applied to the same continuous dataset, so you finish with an end-to-end portfolio rather than disconnected certificates.
One dataset, end to end
You clean it in Python, query it in SQL, model it in Power BI, and present it as a recommendation — the way analysts actually work.
Mentors who still work with client data
Your instructors are active practitioners, not career academics.
Small batch sizes
10–12 students per batch ensures every student gets personalised feedback on every deliverable.
Nested, no-repeat curriculum
Longer programs include everything from shorter tracks and add more depth — you never repeat a module.
Documented internship experience
Every student receives a documented internship certificate alongside their course certificate.
Placement support
Resume and LinkedIn preparation, interview coaching, and active placement assistance for graduates.
Who can join
Who this Data Analyst — Analytics & Business Intelligence course is for
This course works for a specific starting point — here's who gets the most out of it.
Students after 12th
Start with Excel and Python fundamentals and finish with a dashboard portfolio, without needing a prior coding background.
Working professionals
Add SQL and Power BI to your existing domain knowledge and move into analyst roles without leaving your job, using weekend batches.
Career switchers
Move from non-technical work into analytics with a structured path covering Excel, SQL, Python, and Power BI, plus a documented portfolio.
Business owners and freelancers
Learn to query your own sales and operations data, build dashboards, and make decisions from numbers instead of guesswork.
What you actually need before day one
3 / 6 / 9 Months · offline
A laptop or desktop — we help you set it up in the first session
A stable internet connection for the online batches
No prior coding or technical background
Basic English reading — the tools and their documentation are in English
About 6-8 hours a week outside class for practice
Willingness to finish the lab task before the next class
Data Analyst — Analytics & Business Intelligence is the centre. These are the tools you use around it in a working team.
Data Analyst — Analytics & Business Intelligencecore skill
Spreadsheet
Programming Language
Scientific Computing
Data Analysis
Visualization
Visualization
Database Querying
Business Intelligence
Web App Deployment
ExcelSpreadsheet
PythonProgramming Language
NumPyScientific Computing
PandasData Analysis
MatplotlibVisualization
SeabornVisualization
SQLDatabase Querying
Power BIBusiness Intelligence
StreamlitWeb App Deployment
Hands-on projects
Projects you actually ship, not just follow along with.
Each one lands in your portfolio with the working files, the process and something a reviewer can open.
Certification
Get certified in Data Analyst — Analytics & Business Intelligence
Finish the Data Analyst — Analytics & Business Intelligence programme at techcadd Ludhiana and you leave with more than a line on a CV — a verifiable certificate, and the project work that makes it mean something in an interview.
Course completion certificate
Issued in your name on completion of the Data Analyst — Analytics & Business Intelligence syllabus, with a reference number an employer can verify with us.
Project certificate
A separate certificate for the capstone you submit, naming the project so the work is attached to the credential.
Internship letter
Students who complete the live-project phase receive an internship letter covering the duration and the work delivered.
Portfolio you own
Every file, repository and deployed link stays yours — the part of the credential a reviewer can actually open.
techcadd has been training in Ludhiana since 2007. The certificate carries that record; the Data Analyst — Analytics & Business Intelligence work you did carries the rest.
Course completion
This is to certify that
has successfully completed the Data Analyst — Analytics & Business Intelligence programme
Data Analyst — Analytics & Business Intelligence Program
Project & internship
This is to certify that
for project work delivered under supervision in Ludhiana
Data Analyst — Analytics & Business Intelligence capstone
Where it takes you
Where this course takes you
The route from your first module to the roles Data Analyst — Analytics & Business Intelligence opens — and the work that has to exist at each step.
01Learning
02Projects
03Portfolio
04Industry readiness
05Career opportunities
Data Analyst
Employers check your ability to clean data, write SQL queries, and build dashboards that answer a specific business question.
Business Analyst
Employers assess how well you frame a business problem, model the data, and present findings to non-technical stakeholders.
MIS Executive
Employers verify your Excel and reporting skills, including pivot tables, lookup functions, and scheduled report generation.
Power BI Developer
Employers test your data modeling, DAX measures, dashboard design, and publishing workflow.
Reporting Analyst
Employers evaluate your ability to maintain reliable recurring reports and query sets against production data.
Junior Data Scientist
Employers check your ability to train, validate, and interpret predictive models on real datasets.
Salary outlook
What Data Analyst — Analytics & Business Intelligence pays, and where
Indicative ranges for the roles this course opens — what a fresher out of Ludhiana is offered, what the metro and remote markets pay for the same skills, and how that moves with two or three years of work behind you.
Indicative annual packages by role and market
Role
Ludhiana & Punjab
Delhi NCR & Bengaluru
Remote & freelance
Data AnalystEntry
₹2.4–4.2 LPA
₹4–8 LPA
₹20k–45k / project
Business Analyst Entry to mid
₹3.6–6.5 LPA
₹6.5–14 LPA
₹35k–90k / project
MIS ExecutiveEntry to mid
₹3.6–6.5 LPA
₹6.5–14 LPA
₹35k–90k / project
Power BI Developer Mid
₹3.6–6.5 LPA
₹6.5–14 LPA
₹35k–90k / project
Ranges are indicative, drawn from what our own students report and from openings we see through the placement cell. Actual offers depend on your portfolio, the interview and the company — nobody can promise you a number, and we do not.
Data Analyst, Business Analyst , MIS Executive, Power BI Developer and related positions, depending on which part of the syllabus you go deepest on.
The first jump usually comes at 18–24 months, once you have shipped work you can point to. Depth in one area moves it faster than breadth across many.
Yes, and a good number of our students do. Remote and contract work is the reason Ludhiana candidates now compete for the same briefs as metro ones — the portfolio travels, the address does not matter.
IT services, manufacturing and export units running automation, e-commerce and D2C brands, healthcare, education, and the agencies serving all of them. Punjab hiring is broader than it looks from a job board.
It helps with the practical half. The projects and tooling carry into an M.Tech, MCA or a specialisation abroad, and the portfolio is often what separates two applicants with the same marks.
Future scope
Where this takes you over the next five years
The skill does not stand still, and neither does what it is worth.
Year 0–1
Get in on proof of work
Entry roles such as Data Analyst open as soon as you have projects that run. At this stage nobody is asking about your marks — they are asking you to walk through something you built.
Year 2–4
Specialise and get paid for it
The generalists plateau; the specialists do not. Depth in one part of Data Analyst — Analytics & Business Intelligence — the part your first job leans on hardest — is what moves you towards business analyst work.
Year 5+
Own the decisions
Architecture, standards, hiring and mentoring. The technical skill is assumed by now; what you are paid for is judgement, and judgement only comes from having shipped things that mattered.
AI is now part of the job
Teams expect Data Analyst — Analytics & Business Intelligence work to be done alongside AI tooling. It raises the floor on output and raises the bar on what counts as a junior — which is exactly why the fundamentals in this course are taught the hard way.
The scope keeps widening
What used to be one narrow role now touches data, deployment and the product decision behind it. Every extra layer of Data Analyst — Analytics & Business Intelligence you understand is another kind of room you get invited into.
Demand outside the metros
Remote and hybrid hiring means Ludhiana, Jalandhar and Chandigarh candidates now compete for the same roles as Bengaluru ones. Location has stopped being the ceiling it used to be.
Proof beats paper
Hiring has moved to portfolios, take-home tasks and live problem solving. A certificate opens a shortlist; work that runs is what gets you through the round after it.
Data Analyst — Analytics & Business Intelligence / B.Sc. IT graduate
I joined with no background in this. By the third month I was building Data Analyst — Analytics & Business Intelligence work on my own, and the project reviews are where I actually learnt to do it properly.
HS
Harman Sethi
Data Analyst — Analytics & Business Intelligence / Now working as an intern in the field
The classes are practical. Every session ends with a task that has to work, so you cannot fake understanding. That habit helped me most in interviews.
AV
Ankit Verma
Data Analyst — Analytics & Business Intelligence / BCA final year
Doubt support was the difference for me. My trainer sat with my work, found the mistake and made me fix it myself instead of handing over the answer.
SK
Simranjeet Kaur
Data Analyst — Analytics & Business Intelligence / B.Sc. IT graduate
I joined with no background in this. By the third month I was building Data Analyst — Analytics & Business Intelligence work on my own, and the project reviews are where I actually learnt to do it properly.
HS
Harman Sethi
Data Analyst — Analytics & Business Intelligence / Now working as an intern in the field
The classes are practical. Every session ends with a task that has to work, so you cannot fake understanding. That habit helped me most in interviews.
AV
Ankit Verma
Data Analyst — Analytics & Business Intelligence / BCA final year
Doubt support was the difference for me. My trainer sat with my work, found the mistake and made me fix it myself instead of handing over the answer.
NS
Navjot Singh
Data Analyst — Analytics & Business Intelligence / Career switch from operations
I came for the skill and left with a portfolio — projects I could actually demo on a call, not a certificate I had to explain.
SK
Simranjeet Kaur
Data Analyst — Analytics & Business Intelligence / B.Sc. IT graduate
I joined with no background in this. By the third month I was building Data Analyst — Analytics & Business Intelligence work on my own, and the project reviews are where I actually learnt to do it properly.
HS
Harman Sethi
Data Analyst — Analytics & Business Intelligence / Now working as an intern in the field
The classes are practical. Every session ends with a task that has to work, so you cannot fake understanding. That habit helped me most in interviews.
NS
Navjot Singh
Data Analyst — Analytics & Business Intelligence / Career switch from operations
I came for the skill and left with a portfolio — projects I could actually demo on a call, not a certificate I had to explain.
SK
Simranjeet Kaur
Data Analyst — Analytics & Business Intelligence / B.Sc. IT graduate
I joined with no background in this. By the third month I was building Data Analyst — Analytics & Business Intelligence work on my own, and the project reviews are where I actually learnt to do it properly.
HS
Harman Sethi
Data Analyst — Analytics & Business Intelligence / Now working as an intern in the field
The classes are practical. Every session ends with a task that has to work, so you cannot fake understanding. That habit helped me most in interviews.
AV
Ankit Verma
Data Analyst — Analytics & Business Intelligence / BCA final year
Doubt support was the difference for me. My trainer sat with my work, found the mistake and made me fix it myself instead of handing over the answer.
NS
Navjot Singh
Data Analyst — Analytics & Business Intelligence / Career switch from operations
I came for the skill and left with a portfolio — projects I could actually demo on a call, not a certificate I had to explain.
SK
Simranjeet Kaur
Data Analyst — Analytics & Business Intelligence / B.Sc. IT graduate
I joined with no background in this. By the third month I was building Data Analyst — Analytics & Business Intelligence work on my own, and the project reviews are where I actually learnt to do it properly.
AV
Ankit Verma
Data Analyst — Analytics & Business Intelligence / BCA final year
Doubt support was the difference for me. My trainer sat with my work, found the mistake and made me fix it myself instead of handing over the answer.
NS
Navjot Singh
Data Analyst — Analytics & Business Intelligence / Career switch from operations
I came for the skill and left with a portfolio — projects I could actually demo on a call, not a certificate I had to explain.
SK
Simranjeet Kaur
Data Analyst — Analytics & Business Intelligence / B.Sc. IT graduate
I joined with no background in this. By the third month I was building Data Analyst — Analytics & Business Intelligence work on my own, and the project reviews are where I actually learnt to do it properly.
HS
Harman Sethi
Data Analyst — Analytics & Business Intelligence / Now working as an intern in the field
The classes are practical. Every session ends with a task that has to work, so you cannot fake understanding. That habit helped me most in interviews.
AV
Ankit Verma
Data Analyst — Analytics & Business Intelligence / BCA final year
Doubt support was the difference for me. My trainer sat with my work, found the mistake and made me fix it myself instead of handing over the answer.
NS
Navjot Singh
Data Analyst — Analytics & Business Intelligence / Career switch from operations
I came for the skill and left with a portfolio — projects I could actually demo on a call, not a certificate I had to explain.
HS
Harman Sethi
Data Analyst — Analytics & Business Intelligence / Now working as an intern in the field
The classes are practical. Every session ends with a task that has to work, so you cannot fake understanding. That habit helped me most in interviews.
AV
Ankit Verma
Data Analyst — Analytics & Business Intelligence / BCA final year
Doubt support was the difference for me. My trainer sat with my work, found the mistake and made me fix it myself instead of handing over the answer.
NS
Navjot Singh
Data Analyst — Analytics & Business Intelligence / Career switch from operations
I came for the skill and left with a portfolio — projects I could actually demo on a call, not a certificate I had to explain.
Real, unedited feedback from techcadd learners on Google.
Frequently asked questions
Questions before you enrol
The 7 things people ask most often about the Data Analyst — Analytics & Business Intelligence course at techcadd Ludhiana.
The complete Data Analyst — Analytics & Business Intelligence programme runs for 3 / 6 / 9 Months depending on the batch you choose. Weekday, weekend and fast-track options are available, along with shorter modules for students who only need the fundamentals.
School students after 12th, college students from any stream, graduates and working professionals changing track. The first module assumes no prior experience.
No. The course starts from the basics. If you already have some background, your trainer will move you faster through the first module so you reach the project work sooner.
Excel, Python, NumPy, Pandas, Matplotlib, Seaborn, SQL, Power BI and Streamlit — plus the day-to-day tooling and workflow that surrounds them in a real team.
Yes. Each module closes with a lab project, and the course ends with a capstone you can put on your portfolio and defend in an interview.
Placement support includes resume and portfolio review, aptitude and role-specific practice, mock interviews and interview referrals through our hiring network.
Yes. You receive a techcadd Data Analyst — Analytics & Business Intelligence completion certificate, and a separate project certificate for the capstone you submit.
Next batch
Enquire about Data Analyst — Analytics & Business Intelligence
Send this form and a counsellor calls you back about this course
specifically — batch dates, fees and whether it fits what you already
know.
CourseData Analyst — Analytics & Business Intelligence Program